
At the end of September, the NAV price for the fund's A class was 117.07. During the month, the A class increased by 0.07 % and is up 9.26 % since the beginning of the year. Since its inception in December 2023, the fund has outperformed its reference index, OMX Small Cap GI, by approximately 6.34 percentage points.
Despite a portfolio consisting of 110 companies, the fund is the best-performing Swedish micro cap fund this year – and also has the lowest risk in the category.
Market: Swedish small companies and the global market – September
September showed that Swedish small companies can benefit from both national and global trends. The Riksbank's cut in the key interest rate resulted in lower financing costs and strengthened the conditions for small companies, while company valuations for larger companies are starting to become high – making smaller companies more interesting.
Despite this, geopolitical risks remain and weak macro figures from China and the US continue to create uncertainty in the market. In this situation, diversification is important: a broad portfolio with limited exposure to individual companies provides the best opportunity to navigate uncertainty while taking advantage of potential opportunities.
Results
The fund aims to outperform the reference index (OMX Small Cap GI) by a few percentage points per year at a lower risk than the reference index. You know roughly what you are getting into, as the fund is index-linked, the investor can expect a return similar to the index on average per year. Since its inception in 2006, the OMX Small Cap index has returned approximately 12%/year at a volatility of 17%.
This year, the fund is the best Micro Cap and also stands strong among small-cap funds.
The average weight of the portfolio holdings during March was 0.96%. Anything above 0.96% means that the fund is overweight the company and below 0.96% means that the fund is underweight. The fund has a realized 60-day volatility of 12% which can be seen as low compared to indices and other equity funds.
Return after fees, Class A
| September | 2025 | Since the fund's inception, Dec 2023 | |
| OMX 30 GI | 1.49% | 10,62% | 21.63% |
| OMX Small Cap GI | -0.33% | 16,3% | 11,47% |
| OMX Mid Cap GI | 0,56% | 6,42% | 34,10% |
| Finserve Micro Cap A | 0.07% | 9,26% | 17,07% |
The fund invests exclusively in companies with a clear positive trend, based on technical and quantitative analysis. All capital is directed towards stocks that show strength in price development and momentum.
The smallest small-cap stocks in the portfolio often have low market correlation and are driven more by company-specific factors. Several of these have performed positively despite a weaker stock market climate, strengthening the fund's independence from broad market movements.
When a position grows too large, it is scaled down and the portfolio's risk is spread more evenly. This way, we can maintain exposure to trend-setting holdings while reducing overall risk.
The table below shows the best and weakest holdings of the month. The fund works systematically to maintain higher exposure to companies in strong trends and minimize exposure to weak stocks – a strategy that has historically created stable excess returns over time.
Best companies in the portfolio and average weight during the month
| Name | Return Sep % | Contribution % | Weight % |
| Orexo AB | 58.37 | 0.51 | 0.88 |
| Coinshare Int Ltd | 40.16 | 0,45 | 1,13 |
| Studsvik AB | 23.00 | 0,30 | 1.32 |
| Xspray Pharma AB | 31.87 | 0,27 | 0,85 |
| Resurs Holding AB | 25,09 | 0,26 | 1,04 |
Worst company in the portfolio and average weight during the month
| Name | Return Sep% | Contribution % | Weight % |
| Karnell Group AB | -13,11 | -0.12 | 0.90 |
| EQL Pharma AB | -19.41 | -0,17 | 0,88 |
| Saniona AB | -11.52 | -0,18 | 1,59 |
| Ascelia Pharma AB | -31.32 | -0,20 | 0,66 |
| Flat Capital AB B | -26.62 | -0,25 | 1,00 |
Index comparison since the start of the OMX Nasdaq index – There is potential for recovery for the smallest companies
The gap between the different indices, the so-called spread, remains large between large and small companies. OMX Small Cap performed slightly weaker than OMX Mid Cap and OMX Large Cap during the month.
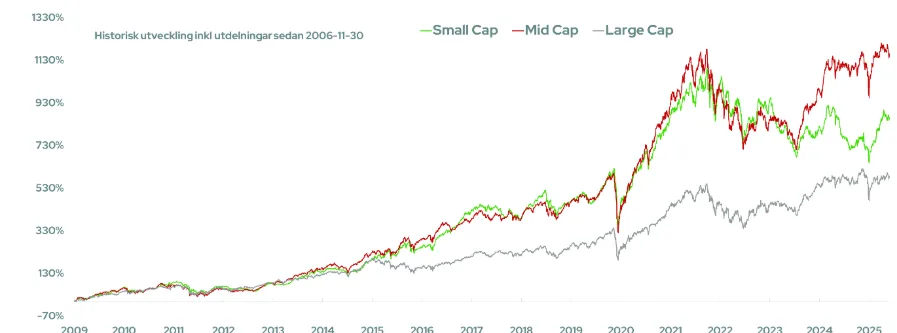
The chart shows OMX Small Cap (green) compared to OMX Mid Cap (red) and OMX Large Cap (grey) since 20081120. Source: Infront
| Small Cap Index: Company value less than approximately SEK 1.5 billion. |
| Mid Cap Index: Company value between approximately SEK 1.5 and 12 billion. |
| Large Cap Index: Company value greater than approximately SEK 12 billion. |
Finserve Micro Cap was highlighted in an Avanza article about Swedish small companies.
Small cap funds making a comeback – that's what's driving the upswing | News from Private Banking
Did you know that?
The growth of index products means that large index companies risk becoming overvalued when they automatically receive more and more capital. This can lead to distortions where certain companies receive a disproportionate amount of money regardless of fundamentals.
Strategy
The fund's goal is to achieve good risk-adjusted returns, offer equity exposure to companies that few other funds own, and to weather downturns well through equal weighting and even sector exposure.
The fund rebalances all positions every six months. Historically, the strategy of equal-weighting a broad equity portfolio has resulted in higher risk-adjusted returns compared to market-value-weighted broad portfolios. This outperformance can be attributed to the strategy's ability to better handle downturns, unlike value-weighted portfolios that are often heavily concentrated in individual stocks. The strategy is based on trend-following investments between equal-weightings, focusing on companies that exhibit low volatility and a clear positive trend.
Finserve Micro Cap invests in companies listed on the regulated market. The portfolio consists of more than 100 companies listed on the OMX Small Cap and OMX Mid Cap lists over time. The companies in the portfolio have an average company value of approximately SEK 2.5-3.5 billion over time. This value is significantly lower than the average among competitors' micro cap and small company funds.
Thanks to regular equal weighting, the trend strategy and the fact that the fund is one of the few fund owners in many of the companies, the fund has a low correlation with traditional micro cap and small cap funds.