
Will the recovery for the smallest come in 2026?
At the end of November, the NAV price for the fund's A class was 112.32. During the month, the A class fell by 3.16 % and is up 4.40 % since the beginning of the year. Since its inception in December 2023, the fund has outperformed its reference index, OMX Small Cap GI, by approximately 5.05 percentage points.
The fund has a broad portfolio of more than 100 companies to cope with liquidity that is weak in many companies despite being listed on the main list. All incoming capital goes broadly to trending companies. The fund is the sole fund owner of many companies despite the companies being listed on the main list of the Stockholm Stock Exchange.
The reporting season is over and it offered a traditional mean reversion
The reporting season that spanned October and early November showed clear mean reversion among Swedish micro companies. Previous winners met high expectations and fell easily on weak reports, while previously weak stocks surprised positively when both sentiment and fundamentals improved. Micro companies are also more affected than larger companies by capital flows and sentiment, which amplifies these movements.
Equal weighting continues to work well in the segment as it captures the recovery in laggards while yesterday's winners often lose momentum. For investors, this means that a more contrarian approach may be beneficial.
Positive drivers for micro-companies in 2026
The outlook for 2026 is brighter. SBAB expects higher GDP growth, rising real incomes and a more stable interest rate environment, factors that historically benefit smaller, domestic companies. After several years of weak share price performance, several players believe that the small-cap sector could face a broad recovery in 2026.
In addition to the macro trend, the outlook is also strengthened by structural factors: increased investments, a gradually improving housing and labor market, and an interest rate level significantly lower than the peak levels in 2023–2024. This creates a more favorable climate for growth companies with significant exposure to the Swedish economy.
Results
Return after fees, class A
| November | 2025 | Since the fund's inception, Dec 2023 | |
| OMX 30 GI | 0,91% | 15,73% | 28.02% |
| O MX Small Cap GI | -2,72% | 11,91% | 7,27% |
| OMX Mid Cap GI | -2,11% | 6,51% | 34,17% |
| Finserve Micro Cap A | -3,16% | 4,40% | 12,32% |
Best companies in the portfolio and average weight during the month
The fund is kept close to fully invested via a credit facility with a Swedish investment bank, which strengthens returns by avoiding unnecessary cash. The capital is invested only in companies with a clear positive trend according to the fund's systematic model. Large positions are scaled down to keep the risk even and maintain focus on the most trending stocks.
The portfolio companies have low market correlation and are driven primarily by company-specific factors. Several have performed strongly despite weak market conditions, increasing the fund's independence from broad market movements. The overlap with other micro cap and small cap funds is low, making the fund an effective complement to a diversified portfolio.
The model automatically weights strong stocks up and weak stocks down. In November, the average weight per holding was 0.99 %. The fund's 60-day volatility is 12.2 %, significantly lower than the index and many other equity funds.
| Name | Return Nov% | Contribution % | Weight % |
| Orron Energy AB | 31,23 | 0,24 | 0,79 |
| Saniona AB | 11,91 | 0,23 | 1,91 |
| Cantargia AB | 16,96 | 0,18 | 1,1 |
| Ambea AB | 9,63 | 0,13 | 1,32 |
| Moberg Pharma AB | 15,32 | 0,13 | 0,82 |
Worst company in the portfolio and average weight during the month.
| Name | Return Nov% | Contribution % | Weight % |
| TF Bank AB | -11,28 | -0,14 | 1,12 |
| Flat Capital AB B | -16,11 | -0,19 | 1,18 |
| Arla Plast AB | -19,73 | -0,22 | 1,13 |
| Catena Media PLC | -32,15 | -0,26 | 0,81 |
| United Global 7 AB | -21,88 | -0,27 | 1,26 |
Index comparison since the start of the OMX Nasdaq index – There is potential for recovery for the smallest companies in 2026. The gap between the different indices, the so-called spread, remains large between large and smaller small caps. OMX Small Cap performed slightly better than OMX Mid Cap and slightly worse than OMX Large Cap during the month.
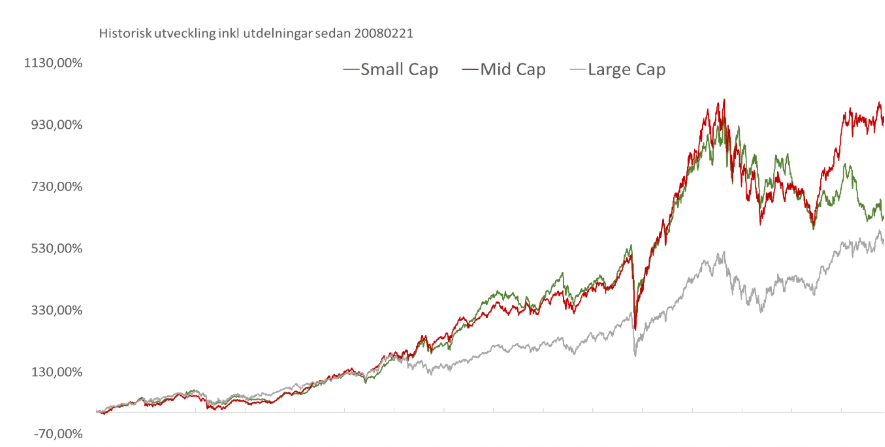
The chart shows OMX Small Cap (green) compared to OMX Mid Cap (red) and OMX Large Cap (grey) since 20081120. Source: Infront
| Small Cap Index: Company value less than approximately SEK 1.5 billion, micro companies |
| Mid Cap Index: Company value between approximately SEK 1.5 and 12 billion, micro companies |
| Large Cap Index: Company value greater than approximately SEK 12 billion. |
Did you know that: In the fund industry, company size is often defined according to the following benchmarks:
Micro companies: Companies with a market capitalization of less than approximately SEK 15 billion, corresponding to approximately 0.1 trillion of the total market capitalization.
Small companies: Companies with a market capitalization of less than approximately SEK 150 billion, corresponding to approximately 1.1% of the total market capitalization.
These levels are industry practice and may vary slightly between different fund companies and index providers, but they provide a clear indication of how companies are typically categorized based on market value.
Strategy
The fund's goal is to achieve good risk-adjusted returns, offer equity exposure to companies that few other funds own, and to weather downturns well through equal weighting and even sector exposure.
The fund rebalances all positions every six months. Historically, the strategy of equal-weighting a broad equity portfolio has resulted in higher risk-adjusted returns compared to market-value-weighted broad portfolios. This outperformance can be attributed to the strategy's ability to better handle downturns, unlike value-weighted portfolios that are often heavily concentrated in individual stocks. The strategy is based on trend-following investments between equal-weightings, focusing on companies that exhibit low volatility and a clear positive trend.
Finserve Micro Cap invests in companies listed on the regulated market. The portfolio consists of more than 100 companies listed on the OMX Small Cap and OMX Mid Cap lists over time. The companies in the portfolio have an average company value of approximately SEK 2.5-3.5 billion over time. This value is significantly lower than the average among competitors' micro cap and small company funds.
Thanks to regular equal weighting, the trend strategy and the fact that the fund is one of the few fund owners in many of the companies, the fund has a low correlation with traditional micro cap and small cap funds.