
Consumer and medtech sector in focus
The NAV price for the fund's A class was 109.15 in December. The fund's A class rose by 1.45% in January and has been 8.09 percentage points better than the fund's reference index OMX Small Cap GI since its inception in December 2023.
The fund aims to outperform the fund's benchmark index (OMX Small Cap GI) by a few percentage points per year at lower risk than the benchmark index. The average weight of the portfolio holdings during January was 0.89%. Anything above 0.89% means that the fund is overweight the company and below 0.89% means that the fund is underweight. The fund has a realized 60-day volatility of 12%.
Return after fees, Class A
| YTD | 2025 | Since the fund's inception, Dec 2023 | |
| OMX 30 GI | 6,45% | 6,45% | 17,61% |
| OMX Small Cap GI | 2,44% | 2,44% | 1,06% |
| Finserve Micro Cap A | 1,45% | 1,45% | 9,15% |
Best companies in the portfolio and average weight during the month
| Name | Contribution % | Weight % |
| BHG GROUP AB | 0,45 | 1,26 |
| TOBII AB | 0,29 | 1,21 |
| MYSAFTEY GROUP AB | 0,23 | 0,87 |
| G5 ENTERTAINMENT | 0,21 | 1,21 |
| DYNAVOX GROUP AB | 0,19 | 1,07 |
Worst company in the portfolio and average weight during the month
| Name | Contribution % | Weight % |
| MEDCAP AB | -0,40 | 0,97 |
| STILLFRONT GROUP AB | -0,24 | 0,88 |
| ENAD GLOBAL 7 AB | -0,19 | 1,02 |
| BIOINVENT INTERNATIONAL AB | -0,18 | 0,61 |
| PREVAS AB-B SHS | -0,12 | 0,94 |
Many of this year's stock market winners are found in the OMX Small Cap index. The winners are the very least Medtech companies (below) with extremely high volatility market capitalizations below 100 million SEK. The fund focuses on companies with low volatility and companies that overtime have a higher company value than 500 million SEK. This is one explanation for the fund's not presenting in line with the OMX Small Cap during January.
| Name | This year | Volume, 60 days | Market value | Included in the portfolio portfolio |
| Q-Linnea | 339% | 470,6% | 50 million SEK | N/A |
| Synact | 92,97% | 92,97% | SEK 848 million | 0,76% |
| Alligator Cinema | 48,22% | 387,01% | SEK 24 million | N/A |
| Fastator | 39,56% | 76,02% | SEK 137 million | N/A |
| Nelly | 33,91% | 40,77% | SEK 1162 million | 0,91% |
Index comparison
The Small Cap Index performed slightly better than the Mid Cap index during the first month of the year. The gap between OMX Large Cap and OMX Small Cap increased and the difference since the beginning of the year is 4.08 percentage points. Historically, since the indices started, OMX Small Cap and OMX Mid Cap have followed each other relatively evenly over time and OMX Small Cap has performed better than OMX Large Cap. However, since October 2023, OMX Small Cap has performed worse than both OMX Mid Cap and Large Cap. This shows that there is potential for recovery for the companies included in the OMX Small Cap index going forward.
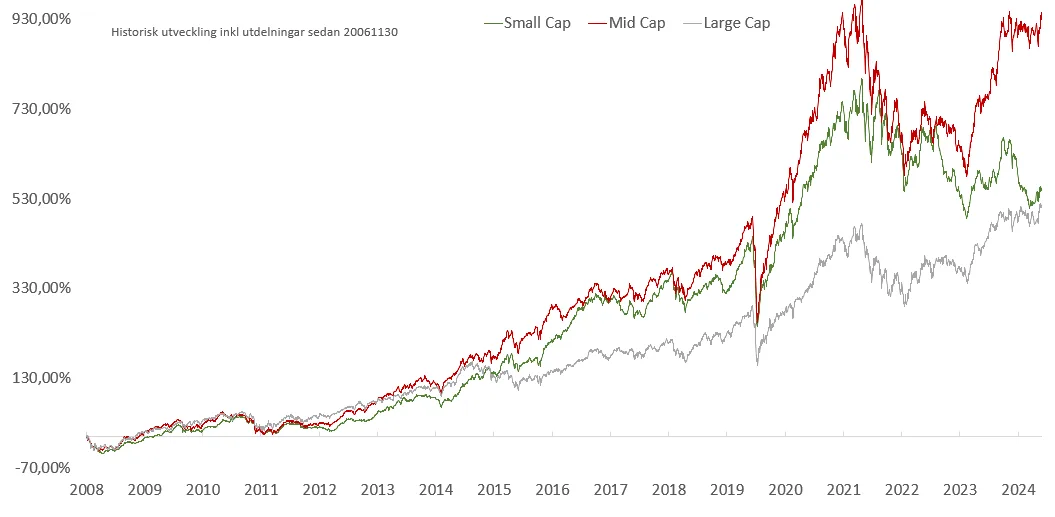
The chart shows OMX Small Cap (green) compared to OMX Mid Cap (red) and OMX Large Cap (grey) since 20061130. Source: Infront
| Small Cap Index: Company value less than approximately SEK 1.5 billion. |
| Mid Cap Index: Company value between approximately SEK 1.5 and 12 billion. |
| Large Cap Index: Company value greater than approximately SEK 12 billion. |
The market
In early 2025, stock markets were strong despite uncertainty over potential tariffs from Trump and rising inflation risks. DeepSeek’s launch of its new AI model caught the eye of investors and caused a brief decline in US tech stocks. European stocks, meanwhile, rose, driven mainly by a rotation out of US tech and signs of improving economic activity in the eurozone.
At the same time, expectations of higher US inflation – in the wake of President Trump's proposed tax cuts, tariffs and stricter immigration policies – pushed up the yield on long-term US government bonds before it retreated after weaker-than-expected inflation data.
The differences in central banks' monetary policies continued to be at the center of attention in January, with a wait-and-see Fed, a more expansionary ECB & Riksbank, and a tightening Bank of Japan.
Forecast
We clearly see that there is potential in the smallest small companies, given the implemented and possible upcoming interest rate cuts. The companies in the OMX Small Cap Index and smaller companies in the OMX Mid Cap Index have significantly lagged behind the development compared to larger companies.
In the event of an inflow, the fund systematically allocates more capital to companies with the best trend. In 2024, the portfolio had exposure to 9 out of 10 stock market winners and overweight to 7 out of 10 companies. Of the stock market losers in 2024, the portfolio had exposure to 1 out of 10. This can be interpreted as both a good thing in the event of a recovery in several of the smallest companies included in the OMX Small Cap and OMX Mid Cap indices.
The companies that the fund currently has the highest weighting belong to the medtech and consumer sectors. Two sectors that are affected by interest rates and have started to show recovery in line with lower interest rates and increased risk appetite. There are also indications that the real estate sector is recovering after a few months of negative development.
Did you know that?
The majority of all new savings go into index funds or ETFs today and that growth is high?
Read what we think The consequences will be increased index savings.
Source: ICI's
Strategy
The fund's goal is to achieve good risk-adjusted returns, offer equity exposure to companies that few other funds own, and to weather downturns well through equal weighting and even sector exposure.
The fund rebalances all positions every six months. Historically, the strategy of equal-weighting a broad equity portfolio has resulted in higher risk-adjusted returns compared to market-value-weighted broad portfolios. This outperformance can be attributed to the strategy's ability to better handle downturns, unlike value-weighted portfolios that are often heavily concentrated in individual stocks. The strategy is based on trend-following investments between equal-weightings, focusing on companies that exhibit low volatility and a clear positive trend.
Finserve Micro Cap invests in companies listed on the regulated market. The portfolio consists of more than 100 companies listed on the OMX Small Cap and OMX Mid Cap lists over time. The companies in the portfolio have an average company value of approximately SEK 2.5-3.5 billion over time. This value is significantly lower than the average among competitors' micro cap and small company funds.
Thanks to regular equal weighting, the trend strategy and the fact that the fund is one of the few fund owners in many of the companies, the fund has a low correlation with traditional micro cap and small cap funds.