
The NAV price for the fund's A class was 117.49 in August. The fund's A class fell by 1.50% in August and has been around 5.65 percentage points better than the fund's reference index OMX Small Cap GI since its inception in December 2023.
Market August
The Swedish small cap index fell slightly during August, while the mid cap segment developed more or less neutrally. Global trade tensions, increased geopolitical uncertainty and a weaker dollar dampened risk appetite, leading to some profit-taking after the summer's gains. Companies with strong reports held up well, while those with slightly weaker results were severely punished, underscoring both the importance of company-specific value creation and the importance of diversification in a turbulent market.
Results
The fund aims to be a few percentage points better than the fund's reference index (OMX Small Cap GI) per year at lower risk than the reference index. You know roughly what you are getting into because the fund is index-like, the investor can expect a return similar to the index on average per year. Since its inception in 2006, the OMX Small Cap index has returned approximately 12%/year at a volatility of 17%. This year, the fund is one of the best Micro Cap and small-cap funds.
The average weight of the portfolio holdings during March was 0.96%. Anything above 0.96% means that the fund is overweight the company and below 0.96% means that the fund is underweight. The fund has a realized 60-day volatility of 12% which can be seen as low compared to indices and other funds.
Return after fees, Class A
| August | 2025 | Since the fund's inception, Dec 2023 | |
| OMX 30 GI | 2,51% | 9,35% | 20.96% |
| OMX Small Cap GI | -1,67% | 16,68% | 11,84% |
| OMX Mid Cap GI | -0,01% | 5,87% | 33,36% |
| Finserve Micro Cap A | -1,50% | 9,20% | 17,49% |
The fund invests exclusively in companies with a clear positive trend, based on technical and quantitative analysis. All capital is directed towards stocks that show strength in price development and momentum. This focused strategy creates good conditions for high risk-adjusted returns with low correlation to broad large cap indices.
The smallest small-cap stocks in the portfolio often have low market correlation and are driven more by company-specific factors. Several of these have performed positively despite a weaker stock market climate, strengthening the fund's independence from broad market movements.
When a position grows too large, it is scaled down and the portfolio's risk is spread more evenly. This way, we can maintain exposure to trend-setting holdings while reducing overall risk.
The table below shows the best and weakest holdings of the month. The fund works systematically to maintain higher exposure to companies in strong trends and minimize exposure to weak stocks – a strategy that has historically created stable excess returns over time.
Best companies in the portfolio and average weight during the month
| Name | Return Aug % | Contribution % | Weight % |
| Viaplay Group AB | 48,69 | 0,79 | 1,63 |
| Saniona AB | 41,07 | 0,44 | 1,16 |
| Net Insight AB B | 27,29 | 0,24 | 2,20 |
| Vicore Pharma Holding AB | 16,27 | 0,20 | 0,74 |
| TF Bank AB | 11,84 | 0,19 | 1,14 |
Worst company in the portfolio and average weight during the month
| Name | Return Aug% | Contribution % | Weight % |
| EQL Pharma AB | -12,76 | -0,17 | 1,10 |
| Intrum AB | -12,83 | -0,18 | 1,29 |
| Ovzon AB | -13,75 | -0,19 | 1,64 |
| Bico Group AB | -34,49 | -0,23 | 0,67 |
| Oncopeptides AB | -13,76 | -0,24 | 1,28 |
Index comparison since the start of the OMX Nasdaq index – There is potential for recovery for the smallest companies
The gap between the different indices, the so-called spread, remains large between large and small companies. OMX Small Cap performed slightly weaker than OMX Mid Cap OMX Large Cap during the month.
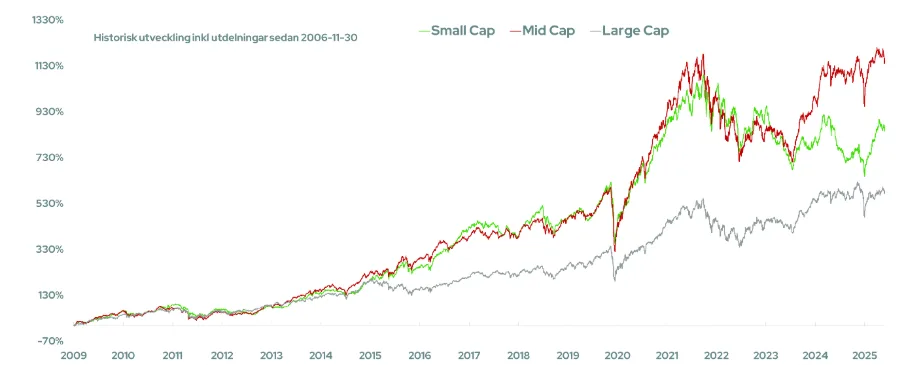
The chart shows OMX Small Cap (green) compared to OMX Mid Cap (red) and OMX Large Cap (grey) since 20081120. Source: Infront
| Small Cap Index: Company value less than approximately SEK 1.5 billion. |
| Mid Cap Index: Company value between approximately SEK 1.5 and 12 billion. |
| Large Cap Index: Company value greater than approximately SEK 12 billion. |
Did you know that?
The OMX Small Cap Index has the lowest historical volatility compared to the OMX Mid Cap, OMX Large Cap and OMX 30.
Strategy
The fund's goal is to achieve good risk-adjusted returns, offer equity exposure to companies that few other funds own, and to weather downturns well through equal weighting and even sector exposure.
The fund rebalances all positions every six months. Historically, the strategy of equal-weighting a broad equity portfolio has resulted in higher risk-adjusted returns compared to market-value-weighted broad portfolios. This outperformance can be attributed to the strategy's ability to better handle downturns, unlike value-weighted portfolios that are often heavily concentrated in individual stocks. The strategy is based on trend-following investments between equal-weightings, focusing on companies that exhibit low volatility and a clear positive trend.
Finserve Micro Cap invests in companies listed on the regulated market. The portfolio consists of more than 100 companies listed on the OMX Small Cap and OMX Mid Cap lists over time. The companies in the portfolio have an average company value of approximately SEK 2.5-3.5 billion over time. This value is significantly lower than the average among competitors' micro cap and small company funds.
Thanks to regular equal weighting, the trend strategy and the fact that the fund is one of the few fund owners in many of the companies, the fund has a low correlation with traditional micro cap and small cap funds.