
The NAV price for the fund's A class was 108.03 in May. The fund's A class rose by 4.74% in May and has been around 7.4 percentage points better than the fund's reference index OMX Small Cap GI since its inception in December 2023.
Market May
During May, the small-cap market developed strongly globally, with gains of around 6% %. The development was mainly driven by an improved risk appetite among investors, against a backdrop of softer inflation figures, stronger consumer confidence and increased optimism about global trade relations. A pause in US tariff increases and progress in trade negotiations with the EU contributed to the positive sentiment. On the macro side, the month was characterized by a more cautious stance by central banks – the US Federal Reserve kept its policy rate unchanged, while the European Central Bank cut its interest rate in early June and the Riksbank is expected to follow suit. Inflation continued to fall, both in the US and Europe, which increased expectations of more interest rate cuts in the future. At the same time, increased concern was noted in the bond market, partly as a result of weak demand at US loan auctions and a downgrade of the US credit rating. Overall, small cap stocks benefited from reduced interest rate concerns and improved prospects, although some uncertainty remains regarding the global economy and fiscal stability.
Results
The fund aims to outperform the fund's benchmark index (OMX Small Cap GI) by a few percentage points per year at lower risk than the benchmark index. The average weight of the portfolio holdings during March was 0.95%. Anything above 0.95% means that the fund is overweight the company and below 0.95% means that the fund is underweight. The fund has a realized 60-day volatility of 13.89%.
Return after fees, Class A
| May | 2025 | Since the fund's inception, Dec 2023 | |
| OMX 30 GI | 2,99% | 3,17% | 14,13% |
| OMX Small Cap GI | 5,57% | 5,04% | 0,68% |
| Finserve Micro Cap A | 4,74% | 0,41% | 8,03% |
Best companies in the portfolio and average weight during the month
| Name | Yield % | Contribution % | Weight % |
| Tobii AB | 42,27 | 0,89% | 2,05 |
| Mysafety Group AB | 41,53 | 0,79% | 1,63 |
| Ovzon AB | 25,96 | 0,72% | 1,55 |
| Stillfront Group AB | 27,22 | 0,53% | 1,08 |
| Dynavox AB | 26,45 | 0,36% | 1,79 |
Worst company in the portfolio and average weight during the month
| Name | Yield % | Contribution % | Weight % |
| Mining company Viscaria | -36,93 | -0,19% | 1,75 |
| Synact Pharma AB | -18,01 | -0,21% | 2,27 |
| Arctic Paper | -6,92 | -0,25% | 0,81 |
| Bonava AB | -13,13 | -0,32% | 0,86 |
| Tradedoubler AB | -24,01 | -0,39% | 1,20 |
Index comparison
The gap or so-called spread remains large between large and small cap companies. OMX Small Cap performed a couple of percentage points better than both OMX Mid Cap and OMX Large Cap during the month.
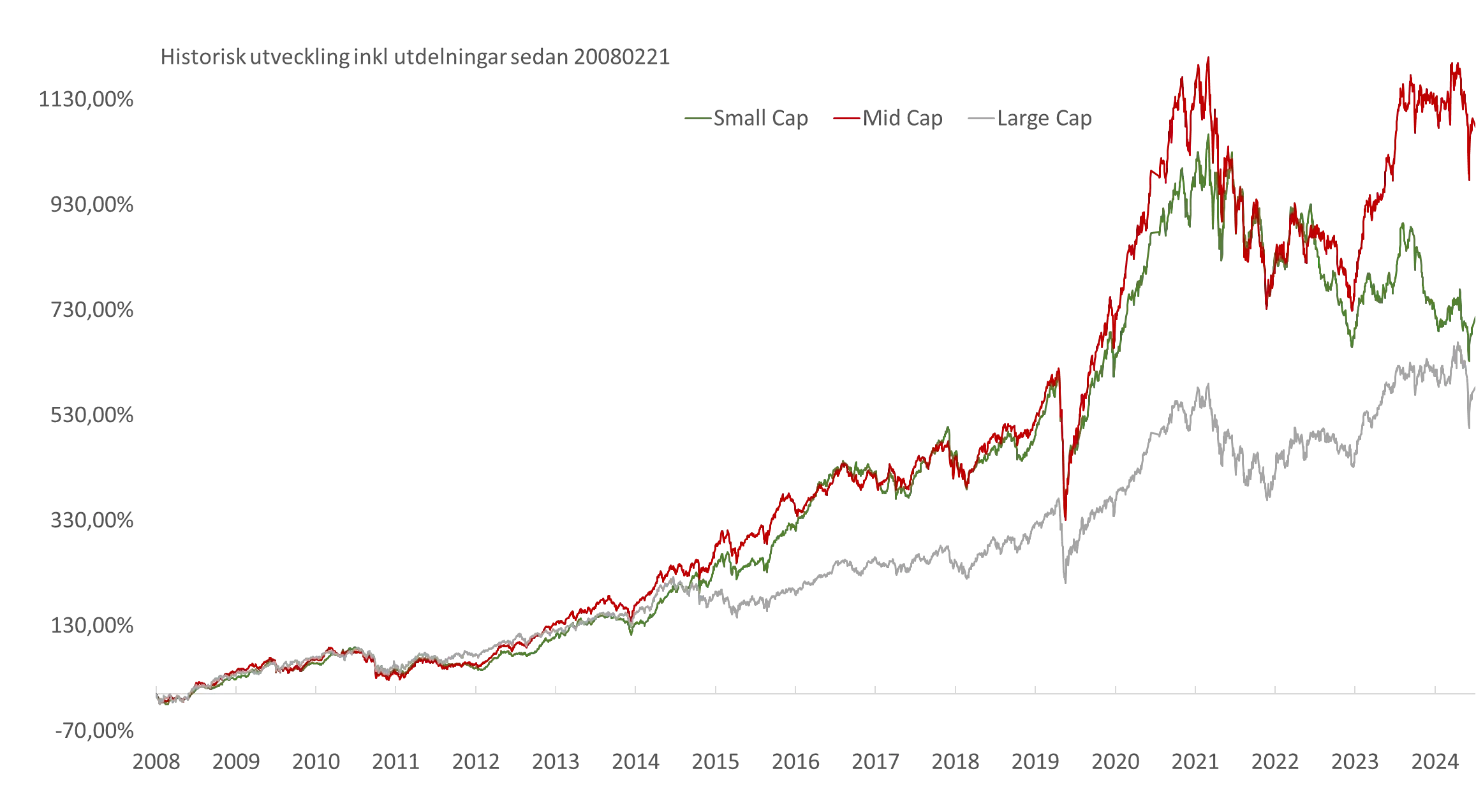
The chart shows OMX Small Cap (green) compared to OMX Mid Cap (red) and OMX Large Cap (grey) since 20081120. Source: Infront
| Small Cap Index: Company value less than approximately SEK 1.5 billion. |
| Mid Cap Index: Company value between approximately SEK 1.5 and 12 billion. |
| Large Cap Index: Company value greater than approximately SEK 12 billion. |
Did you know that?
Small companies have higher company risk than market risk compared to large companies, which makes it possible for them to generate positive returns even if the stock market is generally negative.
Strategy
The fund's goal is to achieve good risk-adjusted returns, offer equity exposure to companies that few other funds own, and to weather downturns well through equal weighting and even sector exposure.
The fund rebalances all positions every six months. Historically, the strategy of equal-weighting a broad equity portfolio has resulted in higher risk-adjusted returns compared to market-value-weighted broad portfolios. This outperformance can be attributed to the strategy's ability to better handle downturns, unlike value-weighted portfolios that are often heavily concentrated in individual stocks. The strategy is based on trend-following investments between equal-weightings, focusing on companies that exhibit low volatility and a clear positive trend.
Finserve Micro Cap invests in companies listed on the regulated market. The portfolio consists of more than 100 companies listed on the OMX Small Cap and OMX Mid Cap lists over time. The companies in the portfolio have an average company value of approximately SEK 2.5-3.5 billion over time. This value is significantly lower than the average among competitors' micro cap and small company funds.
Thanks to regular equal weighting, the trend strategy and the fact that the fund is one of the few fund owners in many of the companies, the fund has a low correlation with traditional micro cap and small cap funds.